Blog Detail
04
Nov
arrow_back A Vue Component to Display Tree Chart using Canvas & SVG
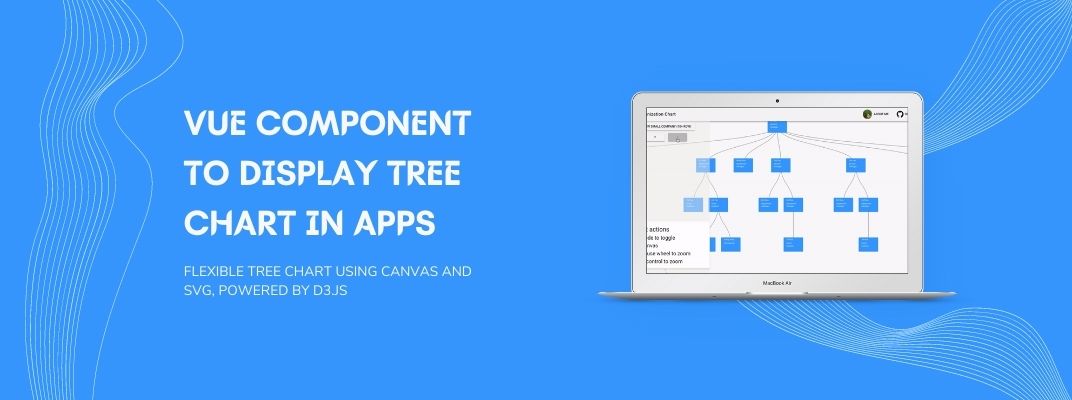
Shen Shuntian came up with a Vue component called Vue-tree-chart. With this component, you can create a flexible tree chart using Canvas and SVG. It is powered by D3.js. You can view its demo here.
Using Technique
Canvas version
- Use D3.js with Canvas to draw organizationChart more efficiently.
- Use unique-color manner to identify mouse click event in Canvas (you can refer to
https://medium.com/@lverspohl/how-to-turn-d3-and-canvas-into-good-friends-b7a240a32915 to see detail)
SVG version
- Use D3 to calculate node & link positon
- Use Vue to handle dom element entering and leaving
- Use Vue slot to let users easily use their own data
Installation
You can install this package via Npm.
npm install @ssthouse/vue-tree-chart
Setup & Usage
After the installation, You’ve to import this component into your Project.
import VueTree from '@ssthouse/vue-tree-chart'
import Vue from 'vue'
Vue.component('vue-tree', VueTree)
basic usage
<template>
  <div class="container">
    <vue-tree
      style="width: 800px; height: 600px; border: 1px solid gray;"
      :dataset="sampleData"
      :config="treeConfig"
    >
    </vue-tree>
  </div>
</template>

<script>
export default {
  name: 'treemap',
  data() {
    return {
      sampleData: {
        value: '1',
        children: [
          { value: '2', children: [{ value: '4' }, { value: '5' }] },
          { value: '3' }
        ]
      },
      treeConfig: { nodeWidth: 120, nodeHeight: 80, levelHeight: 200 }
    }
  }
}
</script>

<style scoped lang="less">
.container {
  display: flex;
  flex-direction: column;
  align-items: center;
}
</style>
Show collapsed node in a different style
<template>
  <div class="container">
    <vue-tree
      style="width: 800px; height: 600px; border: 1px solid gray;"
      :dataset="sampleData"
      :config="treeConfig"
    >
      <template v-slot:node="{ node, collapsed }">
        <span
          class="tree-node"
          :style="{ border: collapsed ? '2px solid grey' : '' }"
          >{{ node.value }}</span
        >
      </template>
    </vue-tree>
  </div>
</template>

<script>
export default {
  name: 'treemap',
  data() {
    return {
      sampleData: {
        value: '1',
        children: [
          { value: '2', children: [{ value: '4' }, { value: '5' }] },
          { value: '3' }
        ]
      },
      treeConfig: { nodeWidth: 120, nodeHeight: 80, levelHeight: 200 }
    }
  }
}
</script>

<style scoped lang="less">
.container {
  display: flex;
  flex-direction: column;
  align-items: center;
}

.tree-node {
  display: inline-block;
  width: 28px;
  height: 28px;
  border-radius: 50%;
  background-color: antiquewhite;
  text-align: center;
  line-height: 28px;
}
</style>
Props
| Name | Type | Default | Description |
|---|---|---|---|
| dataset | [Object,Array] | null | nested tree data or an array of nested tree (multi root tree) |
| config | Object | {nodeWidth: 100, nodeHeight: 100, levelHeight: 200} | nodeWidth and nodeHeight config the tree node size. levelHeight is tree row height |
| linkStyle | String | ‘curve’ | control link style, options: ‘curve’ or ‘straight’ |
| direction | string | ‘vertical’ | control tree chart direction, options: ‘vertical’ or ‘horizontal’ |
| collapse-enabled | Boolean | true | Control whether when clicking on a node it collapses its children |
This package has many options with code examples. If you want to dig more then please visit its complete documentation GitHub.
Published at : 04-11-2021
Rizwan Aslam
I am a highly results-driven professional with 12+ years of collective experience in the grounds of web application development especially in laravel, native android application development in java, and desktop application development in the dot net framework. Now managing a team of expert developers at Codebrisk.

Launch project
